The Harvard Admissions Handbook
From the first circuit appeals ruling and district judge ruling of SFFA v Harvard. This is merely a descriptive summary of the rulings and the admissions process and does not make any normative statements regarding the process. Please comment below if anything is incorrect.
Pre-recruiting
- Harvard buys ACT/SAT scores from Collegeboard. Encourages the top ~100,000 to apply.
- This has no effect on actual admission
- Harvard buys “information” of high school students of all races, minorities, and “sparse country” (20 midwestern/southern states). They specifically recruit minority students through Undergraduate Minority Recruitment Program. Low income students are encouraged to apply for fin aid.
Application Process
Figure from Students for Fair Admissions, Inc. v. President & Fellows of Harvard Coll., 346 F. Supp. 3d 174 (D. Mass. 2018)
Timeline
- EA and regular are evaluated the same way.
- Common app and supplement submitted.
- Admission officers given info of various demographics and compares them to the previous year. Data of applicant pool on race, gender, geographic region, intended concentration, legacy status, financial, etc.
- They try to maintain similar demographics year to year to forecast yield rates.
- 30 staff and 40 admission officers read applications.
- Organized into subgroups based on geography, then divide by high school
- Are given procedures on how to evaluate applications
- 3 sets of readers
- First reader reads application possibly without all submitted material (eg teacher rec)
- Second reader reads if they have expertise
- The Chair can serve as an additional reader if necessary
- Admission subcommittees meet to vouch for their applicants over 3-5 days. Not everyone is discussed. Submit recommendations to full committee.
- Full committee - 40 members. Mostly discuss recommended applicants. All info available at this point (including late letters).
- Every member votes on admission. Majority vote wins.
- ~2000 “tentative admits”. Another round of cuts with tips.
- Decisions are mailed
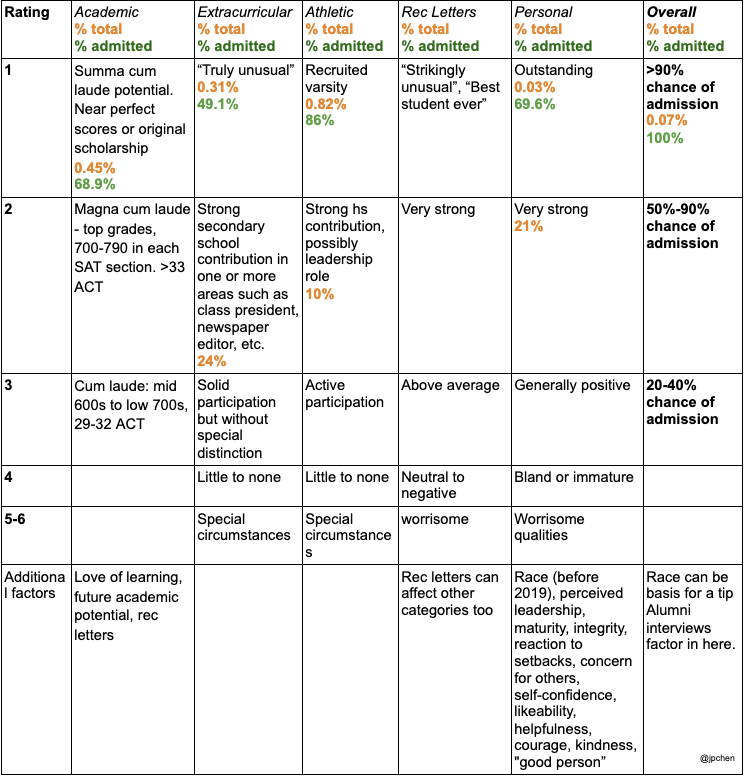
Admission Rubric

Racial demographics of rubric scores
Tips
Additional factors to “tip” in the applicant’s favor during the full committee deliberation. Includes but not limited to:
- Intellectual ability
- Race
- Unusually appealing personal qualities
- Outstanding capacity for leadership
- Creative ability
- Athletic ability
- Legacy status
- Geographic factors
- Economic factors
The Special Kids: Legacy, Athletes, Donors, etc
ALDC applicants are (admission rate for Asians/whites, no data on blacks/hispanics):
- Recruited Athletes (88.4%)
- Legacy (descendant of alumni or faculty) (48%)
- Dean’s Interest List - Children of donors (with donor rating) or famous people (43-48%)
- Added as tips during the full committee deliberation
- 5% of the applicants, 30% of the admitted class
- 43.6% overall admission rate
- Racial breakdown
Staff Interviews
(not to be confused with alumni interviews)
- <3% of all applicants, 20% of ALDC applicants
- 52% admitted, 79% admitted if ALDC
- Racial breakdown
Insightful Data and Analysis
General data
- ~5.5% admission rate overall, 43.6% for ALDC (1980-2019)
- Donors are given ratings based on how big the donor is. Information is included in review.
Racial and Legacy Bonus
- Race is considered in all three stages (first read, subcommittee, and full committee)
- >10% of the admitted class would not be admitted without their race
- Asians and whites have higher yield rates than Blacks, hispanics, and native americans.
- 70% of blacks and 60% of hispanics qualify for full aid
- Race is the determining factor for 45% of all blacks and hispanics.
- 2014-2017: Asian americans admitted at 5-6%, whites admitted at 7-8%
ALDC racial breakdown
Admission rates from Staff interviews
Rubric Score Data
- 7% of applicants receive ratings of 1 or 2 in three or all four categories (excluding recommendation category)
- 70% of these applicants admitted, this makes up 46% of all admissions
- 9% of all whites, 8% of all Asians
- 20%, receive a rating of 1 or 2 in two categories (excluding recommendation category)
- 38% of admissions
- 73% have no rating of 1 or 2 in any category (excluding recommendation category)
- 15% of admissions
- Asians tend to score better on academic and extracurricular, worse for personal.
- Asians with academic score of 1 or 2 admitted at 12% while 18% for non-Asians
- Asians with similar academic ratings tend to underperform compared to whites in recommendations
- ~32% Asians score 1/2 for school recommendations, 33% for whites
- 37% of Asians with top academic scores (1/2) have an average recommendation score of 2.33 or less (less is better)
- 43% for whites
- Academic, extracurricular, or personal ratings of 4 or lower are relatively rare
- more likely to result in rejection than an athletic rating of 4 or lower
Analysis of Athletics + Non-academic factors
- Removing academic factors, 12% whites make top decile, 7.8% asians
- 39% of non-ALDC applicants had 4 or lower for athletic category.
Applicants By Race
ALDC applicants
Non-ALDC applicants
Admitted Students by Race (1980-2019)
Figures from Students for Fair Admissions, Inc. v. President & Fellows of Harvard Coll., 346 F. Supp. 3d 174 (D. Mass. 2018)